Many diseases are caused by or result in changes in normal levels of specific cellular chemicals. Diabetes mellitus, for example, which is caused by abnormally low levels of insulin, results in increased levels of D-glucose in the blood and urine. The development of simple methods for the detection and/or measurement of disease-related biochemicals is an area of research that lies at the interface between chemistry, biology, medicine, and materials science. This topic outlines the general features of biochemical detection devices, biosensors, followed by an historical overview of research involving one aspect of the development of a biosensor for D-glucose.
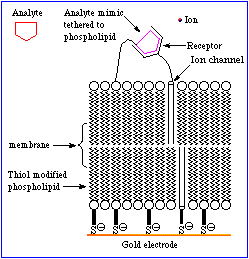
The basic features of a biosensor are shown schematically in Figure 1. The device consists of a receptor that is bonded to an ion channel which is imbedded in a chemically modified membrane. An analyte mimic is tethered to the outer surface of the membrane in close proximity to the ion channel. Under normal conditions the mimic interacts with the receptor site. An increase in the concentration of analyte results in the displacement of the mimic from the receptor and allows the ion channels in the inner and outer walls of the membrane to align, thereby permitting ions to move to the electrode. This generates an electrical signal which is amplified and detected electronically.
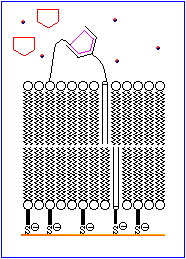
The process is animated in Figure 2.
The rest of this topic focuses on attempts to devise a suitable molecule to serve as a D-glucose specific receptor. A brief discussion of ion channels is avaliable in Chemical Reviews, 1995, 95, 2229-2260.
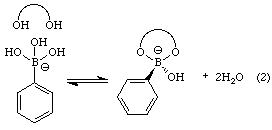
In 1959 J.P. Lorand and J. O. Edwards described the formation of "polyol complexes" of benzeneboronate ion. Their study involved measurement of changes in the value of Keq for the equilibrium outlined in Equation 1.
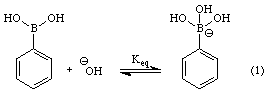
The changes in the value of Keq were induced by the addition of various polyols to the benzeneboronic acid/benzeneboronate mixture. The polyols formed complexes of the type indicated in Equation 2 for a diol of unspecified structure.
The formation of the complexes was accompanied by a change in the pH, which the investigators were able to correlate with Keq. Table 1 lists the values of the equilibrium constants for the formation of complexes between benzeneboronic acid and several common sugars.
|
|
|
|
|
|
|
|
|
|
|
|
|
|
|
|
|
|
|
|
|
Clearly benzeneboronic acid is not an acceptable candidate for a receptor for D-glucose. That is not to say, however, that derivatives of benzeneboronic acid might not be suitable.
In 1991 K. Tsukagoshi and S. Shinkai reported the formation of "polyol complexes" between several sugars and 2,2'-dimethoxydiphenylmethane-5,5'-bisboronic acid. The formation of the complex with D-glucose is outlined in Equation 3.
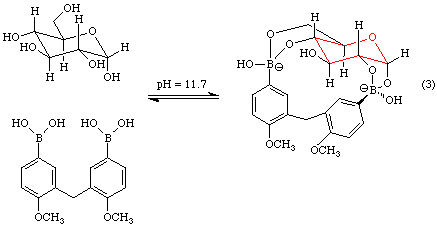
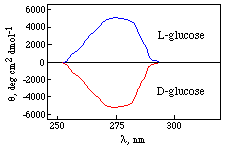
Tsukagoshi and Shinkai studied reaction 3 and analogous reactions with other sugars using circular dichroism. This technique, which is similar to polarimetry, involves measuring the rotation of circularly polarized light as a function of wavelength. The CD spectrum of the complex between D-glucose and 2,2'-dimethoxydiphenylmethane-5,5'-bisboronic acid is shown in Figure 2. The spectrum of the complex with the enantiomeric sugar, L-glucose is shown for comparison. It's important to understand that while D-glucose is optically active, it does not absorb light in the 250-300 nm range. Conversely, 2,2'-dimethoxydiphenylmethane-5,5'-bisboronic acid does absorb light in this wavelength range, but it is not optically active. Thus the spectrum shown in Figure 2 is taken as direct experimental evidence of the formation of a complex betweem these two molecules.
By plotting qmax against the concentration of each sugar, the authors were able to determine the Keq for reaction 3. Table 2 summarizes their findings.
|
|
|
|
|
|
|
|
|
|
|
|
|
|
|
|
|
|
|
|
|
|
|
|
The values of 0 for D-fructose, D-galactose, and D-mannose reflect the fact that mixtures of these compounds with 2,2'-dimethoxydiphenylmethane-5,5'-bisboronic acid were not CD active. While the data clearly indicate that 2,2'-dimethoxydiphenylmethane-5,5'-bisboronic acid is specific for D-glucose, it has three major shortcomings as a potential biosensor receptor. First, detection of the complex requires a UV spectrophotometer, not exactly something you're likely to find in most medicine cabinets. Second, the complex is not formed at a physiological pH of 7.4. Finally, 2,2'-dimethoxydiphenylmethane-5,5'-bisboronic acid is not very soluble in water. These shortfalls led Shinkai and his colleagues to design and synthesize the arylboronic acid shown in Figure 3.
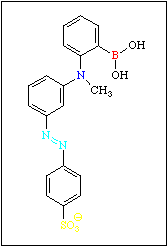
Each of the four color-coded fragments of this molecule serves a specific purpose:
Unfortunately the specificity of this molecule for D-glucose is not high. It appears that a bis boronic acid is required for specificity.
In 1995 J. C. Norrild and H. Eggert reexamined the reaction outlined in Equation 3 and concluded that the structure assigned to the complex by Tsukagoshi and Shinkai was incorrect. As an alternative they proposed that the glucose in the complex was present as a furanose rather than a pyranose. Figure 4 compares these alternatives.
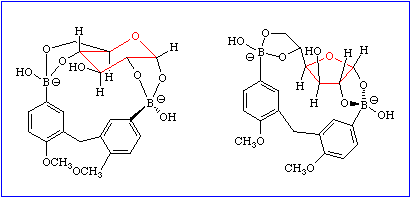
Norrild and Eggert based their structural assignment on NMR data. Specifically they compared coupling constants for the complex with those of a-D-glucopyranose and 1,2:5,6-di-O-isopropylidene-a-D-glucofuranose, two compounds known to exist in the pyranose and furanose forms. Figure 5 shows the structures of these model sugars.
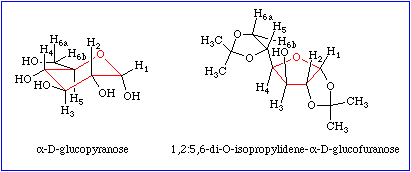
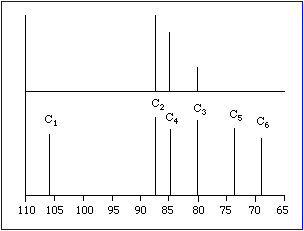
Table 3 compares 1JH-H and 1JC-C values for the three compounds of interest.
|
|
|
|
|
|
|
|
|
|
|
|
|
|
|
|
|
|
|
|
|
|
|
|
|
|
|
|
|
|
|
|
|
|
|
|
|
|
|
|
While the data in Table 3 is persuasive, it is not unambiguous. However, NMR spectroscopy does offer more definitive ways to differentiate between the structures shown in Figure 5. One way involves a technique called Insensitive Nuclei Enhanced by Polarization Transfer or INEPT. To understand how this method can differenitate between the pyranose and furnaose forms of the complex, note that in the fragments H1-C1-O-C5 in the pyranose form and H1-C1-O-C4 in the furanose form there are three bonds between H1 and C4 or C5. If H1 is irradiated with a p/2 pulse and tD is set to 1/(4 3JH-C) sec, then some of the net magnetization from H1 should be transferred to C4 if the glucose is in the furanose form and to C5 if it's in the pyranose form. Figure 6 shows the results of one such INEPT experiment.